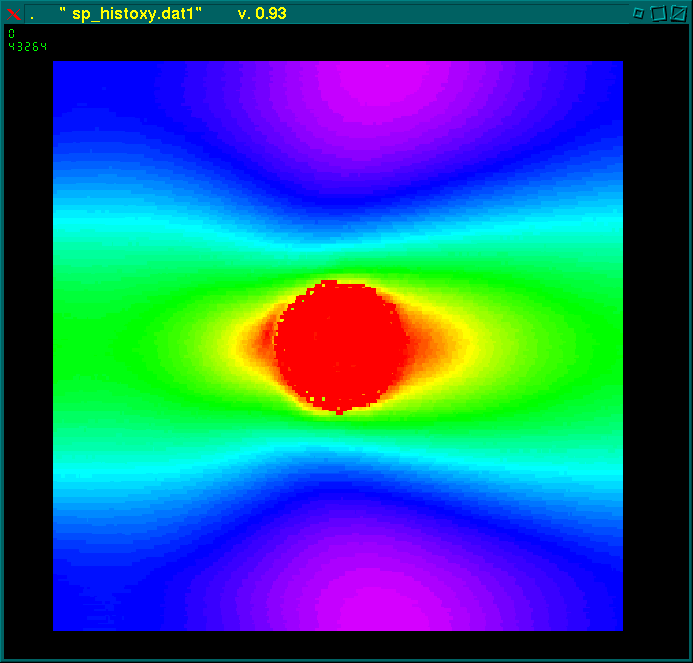
flow past around a cilinder.
The colors shows the velocity field. Red for zero velocity, violet for max velocity.
The command to plot this is:
punto -s 2 -t 1 -G -z 1:2:3 file.dat
the file "file.dat" has three columns: x-position, y-position and
the value of the velocity field.
